It’s likely that most individuals, given the right to do so, not only could provide a self-evaluation but would do so in a way that emphasizes positive points and minimizes any that are less so.Such behavior is not limited to individuals but is present in virtually all human enterprises, including the Postal Service.
The USPS is notoriously and willfully opaque; the agency is Kremlin-like in its resistance to disclosing any more than it must to outsiders.As the saying goes, information is provided on a need-to-know basis and, from the Postal Service’s perspective, outsiders don’t need to know.
For the past two years, however, the Postal Service has been more than forthcoming about its service performance.Every week, it issues a press release touting how well it’s doing, offering a service score that supports the claim without explaining from what that figure was derived.
The agency has been developing its own service performance data for years, in great detail for internal use and, far less so, to comply with the requirements of the Postal Regulatory Commission.Other than the press releases, the only substantive service performance data publicly disclosed by the USPS is its quarterly submissions to the PRC.
The simple fact is that the Postal Service wants to control the message about service performance.It wants to tell its story with the data and scores it selects; the weekly press releases show that.What it doesn’t want to acknowledge is that more granular data shows variable and inconsistent performance, that some areas have chronically poor service, and that a sizeable amount of mail isn’t “in measurement” and therefore not represented by the published scores.
During the kerfuffle over mailed ballots in 2020, the USPS was able to produce whatever detailed data the courts ordered it to produce.It obviously has data at hand for use in its self-congratulatory press releases, but it doesn’t want to reveal much more – though other required reports illustrate what’s missing.
For example, in an August 29 filing with the Postal Regulatory Commission[top table], the Postal Service reported the volume of mail “in measurement” during PQ III (April-June).Total volume was about 25.450 billion pieces, of which only 16.892 billion (66.38%) were “in measurement,” with that further skewed by Marketing Mail letters and outside-county Periodicals for which measured volume was mostly destination-entered.
Moreover, because the USPS measurement process relies on pieces bearing an intelligent mail barcode, documentation from mail preparers, and processing over automated equipment, any mail not meeting one of those basic requirements cannot be included in the volume of mail eligible for measurement, even before other reasons for exclusion apply.
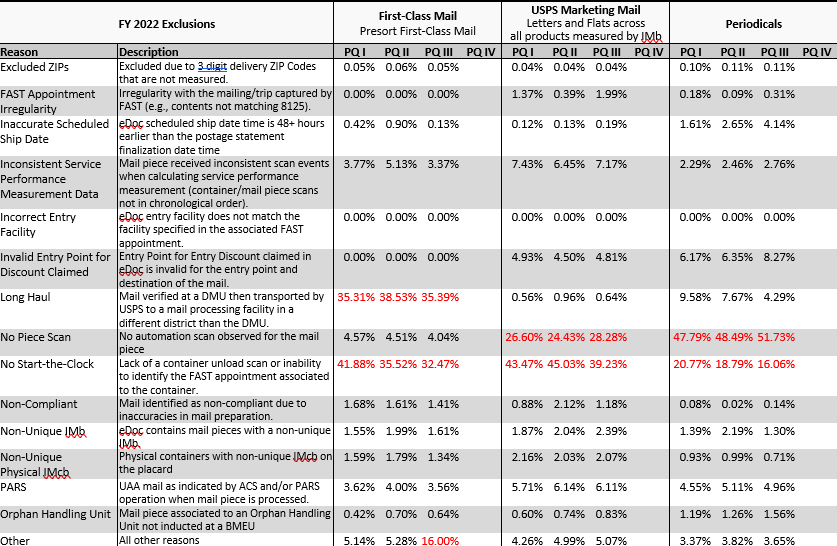
Significant quantities of mail are excluded from measurement for any of several other reasons, as was revealed, for example, in another filing with the Postal Regulatory Commission [bottom table].
While observers may understand the Postal Service’s interest in speaking for itself, observers may not be as understanding if they can see for themselves that what the Postal Service is saying may not be completely accurate. Unfortunately, the agency’s publicists have succeeded at feeding the uncurious and gullible public media (and the public itself) with the “great service” story line; outside the postal community no-one knows there’s more data available that calls the “great service” claims into question.
Sadly, those who realize the difference between truth and perception most clearly are commercial mail producers and their ratepaying clients; they see the reality of service performance every day, and it’s not as "great" as the USPS would like us all to believe.
PQ III/FY 22 | # of Pieces | # of Pieces in | % in Meas | # of Pcs Eligible for Full Service IMB (d) | # of Full Service IMB Pieces | # of FS IMB Pcs Included in Measurement | # of FS IMB Pcs Excluded from Measuremnt (g) | % Excl fr Meas (g/d) | # of Pcs not in Measurement (i) | % not in Msmnt (i/a) |
First Class Mail | 8,386,806,328 | 4,981,842,946 | 59.401% | 8,079,436,575 | 7,770,626,390 | 4,981,842,946 | 2,788,783,444 | 34.517% | 3,404,963,382 | 40.599% |
Prsrt Ltrs/Postcards | 8,265,853,193 | 4,915,188,782 | 59.464% | 7,962,494,920 | 7,663,370,124 | 4,915,188,782 | 2,748,181,342 | 34.514% | 3,350,664,411 | 40.536% |
Overnight | 996,679,995 | 526,550,477 | 52.830% | Unable to Collect | Unable to Collect | 526,550,477 | Unable to Collect | 470,129,518 | 47.170% | |
Two-Day | 834,121,043 | 568,902,214 | 68.204% | Unable to Collect | Unable to Collect | 568,902,214 | Unable to Collect | 265,218,829 | 31.796% | |
Three-Day | 3,423,005,972 | 1,926,502,509 | 56.281% | Unable to Collect | Unable to Collect | 1,926,502,509 | Unable to Collect | 1,496,503,463 | 43.719% | |
Four-Day | 2,070,595,941 | 1,251,353,020 | 60.434% | Unable to Collect | Unable to Collect | 1,251,353,020 | Unable to Collect | 819,242,921 | 39.566% | |
Five-Day | 941,450,241 | 641,880,562 | 68.180% | Unable to Collect | Unable to Collect | 641,880,562 | Unable to Collect | 299,569,679 | 31.820% | |
Presort Flats | 120,953,135 | 66,654,164 | 55.107% | 116,941,655 | 107,256,266 | 66,654,164 | 40,602,102 | 34.720% | 54,298,971 | 44.893% |
Overnight | 7,782,801 | 4,293,710 | 55.169% | Unable to Collect | Unable to Collect | 4,293,710 | Unable to Collect | 3,489,091 | 44.831% | |
Two-Day | 13,433,845 | 7,519,053 | 55.971% | Unable to Collect | Unable to Collect | 7,519,053 | Unable to Collect | 5,914,792 | 44.029% | |
Three-Day | 49,567,639 | 26,703,789 | 53.873% | Unable to Collect | Unable to Collect | 26,703,789 | Unable to Collect | 22,863,850 | 46.127% | |
Four-Day | 35,331,257 | 18,859,266 | 53.378% | Unable to Collect | Unable to Collect | 18,859,266 | Unable to Collect | 16,471,991 | 46.622% | |
Five-Day | 14,837,592 | 9,278,346 | 62.533% | Unable to Collect | Unable to Collect | 9,278,346 | Unable to Collect | 5,559,246 | 37.467% | |
Marketing Mail | 16,125,859,582 | 11,428,630,831 | 70.871% | 13,504,258,516 | 13,267,817,770 | 10,736,270,235 | 2,531,547,535 | 18.746% | 4,697,228,751 | 29.129% |
HD/Sat Ltrs | 1,495,932,472 | 1,187,018,070 | 79.350% | 1,464,781,755 | 1,413,624,056 | 1,187,018,070 | 226,605,986 | 15.470% | 308,914,402 | 20.650% |
Dest Entry 2-Day | 0 | 0 | Unable to Collect | Unable to Collect | 0 | Unable to Collect | 0 | |||
Dest Entry 3-5 Day | 1,344,937,976 | 1,040,245,488 | 77.345% | Unable to Collect | Unable to Collect | 1,040,245,488 | Unable to Collect | 304,692,488 | 22.655% | |
Dest Entry 5-Day + | 79,447,799 | 64,762,866 | 81.516% | Unable to Collect | Unable to Collect | 64,762,866 | Unable to Collect | 14,684,933 | 18.484% | |
End-to-End 3-5 Day | Unable to Collect | 49,589,448 | Unable to Collect | Unable to Collect | 49,589,448 | Unable to Collect | Unable to Collect | |||
End-to-End 6-10 Day | Unable to Collect | 30,349,365 | Unable to Collect | Unable to Collect | 30,349,365 | Unable to Collect | Unable to Collect | |||
End-to-End 11-Day + | Unable to Collect | 2,070,903 | Unable to Collect | Unable to Collect | 2,070,903 | Unable to Collect | Unable to Collect | |||
HD/Sat Flts/Prcls | 2,417,327,083 | 753,558,726 | 31.173% | 438,848,135 | 395,993,926 | 143,679,523 | 252,314,403 | 57.495% | 1,663,768,357 | 68.827% |
Dest Entry 2-Day | 1,314,038,200 | 609,879,203 | 46.413% | Unable to Collect | Unable to Collect | 0 | Unable to Collect | 704,158,997 | 53.587% | |
Dest Entry 3-5 Day | 1,027,899,958 | 125,148,603 | 12.175% | Unable to Collect | Unable to Collect | 125,148,603 | Unable to Collect | 902,751,355 | 87.825% | |
Dest Entry 5-Day + | 21,769,668 | 3,452,929 | 15.861% | Unable to Collect | Unable to Collect | 3,452,929 | Unable to Collect | 18,316,739 | 84.139% | |
End-to-End 3-5 Day | Unable to Collect | 13,048,729 | Unable to Collect | Unable to Collect | 13,048,729 | Unable to Collect | Unable to Collect | |||
End-to-End 6-10 Day | Unable to Collect | 1,987,051 | Unable to Collect | Unable to Collect | 1,987,051 | Unable to Collect | Unable to Collect | |||
End-to-End 11-Day + | Unable to Collect | 42,211 | Unable to Collect | Unable to Collect | 42,211 | Unable to Collect | Unable to Collect | |||
CR (Flts/Ltrs) | 1,067,295,903 | 779,798,515 | 73.063% | 1,041,140,875 | 1,032,509,735 | 779,798,515 | 252,711,220 | 24.273% | 287,497,388 | 26.937% |
Dest Entry 2-Day | 12,786,233 | 0 | 0.000% | Unable to Collect | Unable to Collect | 0 | Unable to Collect | 12,786,233 | 100.000% | |
Dest Entry 3-5 Day | 936,583,042 | 677,659,797 | 72.354% | Unable to Collect | Unable to Collect | 677,659,797 | Unable to Collect | 258,923,245 | 27.646% | |
Dest Entry 5-Day + | 86,011,149 | 75,919,285 | 88.267% | Unable to Collect | Unable to Collect | 75,919,285 | Unable to Collect | 10,091,864 | 11.733% | |
End-to-End 3-5 Day | Unable to Collect | 18,826,302 | Unable to Collect | Unable to Collect | 18,826,302 | Unable to Collect | Unable to Collect | |||
End-to-End 6-10 Day | Unable to Collect | 6,116,475 | Unable to Collect | Unable to Collect | 6,116,475 | Unable to Collect | Unable to Collect | |||
End-to-End 11-Day + | Unable to Collect | 1,276,656 | Unable to Collect | Unable to Collect | 1,276,656 | Unable to Collect | Unable to Collect | |||
Letters | 10,399,342,099 | 8,208,115,247 | 78.929% | 9,996,699,583 | 9,884,464,373 | 8,208,115,247 | 1,676,349,126 | 16.769% | 2,191,226,852 | 21.071% |
Dest Entry 2-Day | 0 | 0 | Unable to Collect | Unable to Collect | 0 | Unable to Collect | 0 | |||
Dest Entry 3-5 Day | 7,552,137,801 | 6,001,885,866 | 79.473% | Unable to Collect | Unable to Collect | 6,001,885,866 | Unable to Collect | 1,550,251,935 | 20.527% | |
Dest Entry 5-Day + | 1,188,940,108 | 1,108,576,014 | 93.241% | Unable to Collect | Unable to Collect | 1,108,576,014 | Unable to Collect | 80,364,094 | 6.759% | |
End-to-End 3-5 Day | Unable to Collect | 386,393,944 | Unable to Collect | Unable to Collect | 386,393,944 | Unable to Collect | Unable to Collect | |||
End-to-End 6-10 Day | Unable to Collect | 685,768,536 | Unable to Collect | Unable to Collect | 685,768,536 | Unable to Collect | Unable to Collect | |||
End-to-End 11-Day + | Unable to Collect | 25,490,887 | Unable to Collect | Unable to Collect | 25,490,887 | Unable to Collect | Unable to Collect | |||
Flats | 610,081,750 | 417,658,880 | 68.459% | 562,788,168 | 541,225,680 | 417,658,880 | 123,566,800 | 21.956% | 192,422,870 | 31.541% |
Dest Entry 2-Day | 0 | 0 | Unable to Collect | Unable to Collect | 0 | Unable to Collect | 0 | |||
Dest Entry 3-5 Day | 295,385,736 | 203,183,683 | 68.786% | Unable to Collect | Unable to Collect | 203,183,683 | Unable to Collect | 92,202,053 | 31.214% | |
Dest Entry 5-Day + | 123,826,101 | 114,990,074 | 92.864% | Unable to Collect | Unable to Collect | 114,990,074 | Unable to Collect | 8,836,027 | 7.136% | |
End-to-End 3-5 Day | Unable to Collect | 25,193,693 | Unable to Collect | Unable to Collect | 25,193,693 | Unable to Collect | Unable to Collect | |||
End-to-End 6-10 Day | Unable to Collect | 72,672,155 | Unable to Collect | Unable to Collect | 72,672,155 | Unable to Collect | Unable to Collect | |||
End-to-End 11-Day + | Unable to Collect | 1,619,275 | Unable to Collect | Unable to Collect | 1,619,275 | Unable to Collect | Unable to Collect | |||
EDDMl | 135,880,275 | 82,481,393 | 60.702% | 0 | 0 | 0 | 0 | 53,398,882 | 39.298% | |
2-Day | 135,880,275 | 82,481,393 | 60.702% | 0 | 0 | 0 | 0 | 53,398,882 | 39.298% | |
Periodicals | 909,382,887 | 478,000,748 | 52.563% | 803,395,161 | 674,659,096 | 478,000,748 | 196,658,348 | 24.478% | 431,382,139 | 47.437% |
In-County | 108,391,866 | 9,492,471 | 8.758% | 101,914,015 | Unable to Collect | 9,492,471 | Unable to Collect | 98,899,395 | 91.242% | |
Dest Entry | Unable to Collect | 4,019,432 | Unable to Collect | Unable to Collect | 4,019,432 | Unable to Collect | Unable to Collect | |||
End-to-End | Unable to Collect | 5,473,039 | Unable to Collect | Unable to Collect | 5,473,039 | Unable to Collect | Unable to Collect | |||
Outside County | 800,991,021 | 468,508,277 | 58.491% | 701,481,146 | Unable to Collect | 468,508,277 | Unable to Collect | 332,482,744 | 41.509% | |
Dest Entry | 617,135,149 | 392,318,047 | 63.571% | Unable to Collect | Unable to Collect | 392,318,047 | Unable to Collect | 224,817,102 | 36.429% | |
End-to-End | 183,855,872 | 76,190,230 | 41.440% | Unable to Collect | Unable to Collect | 76,190,230 | Unable to Collect | 107,665,642 | 58.560% | |
Package Services | 27,729,454 | 3,923,037 | 14.148% | 27,377,715 | 11,083,124 | 3,923,037 | 7,160,087 | 26.153% | 23,806,417 | 85.852% |
BPM Flats | 27,729,454 | 3,923,037 | 14.148% | 27,377,715 | 11,083,124 | 3,923,037 | 7,160,087 | 26.153% | 23,806,417 | 85.852% |
Dest Entry | 24,885,689 | 3,573,132 | 14.358% | Unable to Collect | Unable to Collect | 3,573,132 | Unable to Collect | 21,312,557 | 85.642% | |
End-to-End | 2,843,765 | 349,905 | 12.304% | Unable to Collect | Unable to Collect | 349,905 | Unable to Collect | 2,493,860 | 87.696% |
Leo Raymond is Owner, Mailers Hub. He can be reached at lraymond@mailershub.com.