The next time you encounter a car ad, or one for an investment or dietary supplement, somewhere in the fine print will be a clarification that what’s shown may not be representative of a typical user’s experience. Any moderately aware consumer knows that advertisers want to show you their best while minimizing any acknowledgement that your actual experience – your mileage, financial gain, or weight loss – likely won’t be quite as impressive.
Taking a page from Madison Avenue, the Postal Service has engaged in its own form of such messages, hyping and spinning its service performance unrelentingly in a bid to persuade customers (and commercial mailers) that it’s doing a great job. However, unlike the TV ads, there’s no disclaimer that actual customers’ mailing experiences may vary from what’s being claimed.
The PR
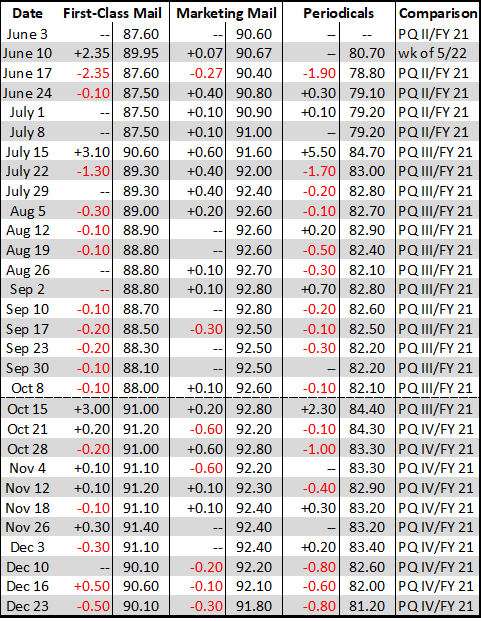
Every week for the past several months, the USPS has issued a press release touting continuous service improvement, strong performance, or something similar, and offering numbers meant to back up the claims. However, the numbers that have been published in the weekly releases since June show the trend actually isn’t as impressive as the USPS wants readers to believe.
Second, what’s not explained is the source of the numbers, or how they’re calculated. In each case, the reported scores are aggregated across the whole nation and an entire class of mail, effectively concealing any poor service situations by homogenizing them with better service scores. Comparing them to the prior quarterly scores further blurs how the weekly numbers don’t always show improvement.
Finally, as commercial mailers know, the Postal Service moved the goalposts as of October 1, lowering its service standards for First-Class Mail and some Periodicals. As a result, the apparent jump in performance as of October 15 (the dashed line in Figure 1), the first week of reporting under the new standards, likely was more due to a lower goal than true improvement.

Figure 1
What also wasn’t well publicized was the decision by the USPS Board of Governors on May 6 (over halfway through the fiscal year) to adjust the FY 21 service targets for First-Class Mail to 84.88% and to 86.62% for Marketing Mail and Periodicals. (The service standard is different from the service target, the latter being the level of achievement of the service standard.) Consequently, by moving the target closer to actual performance, the USPS can claim that it’s hitting its service goals – or getting close to them – when, in fact, such a claim was enabled only by some helpful easing of what’s expected. Of course, more easily achieved targets don’t equate to improved service.
Digging
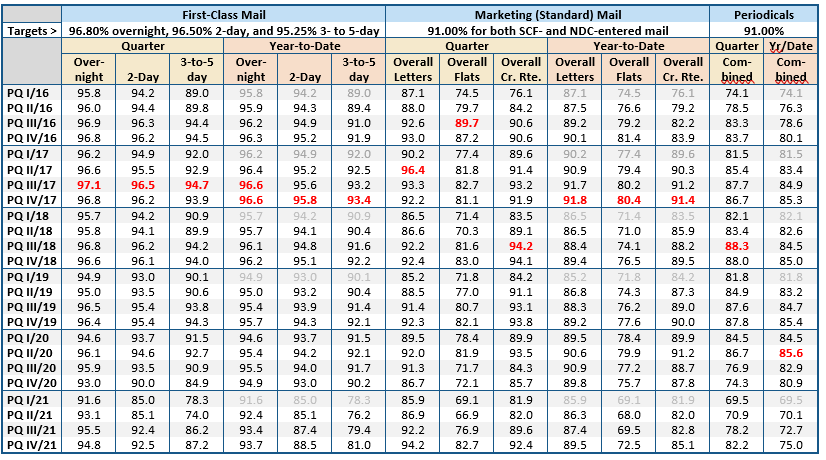
Looking at the national figures that are reported quarterly to the Postal Regulatory Commission suggests that USPS service has declined generally in recent years (the acme of each is in red), aside from the marked drop during the worst of the pandemic, as shown in Figure 2.
Figure 2

(The figures in the chart are for Presorted First-Class Mail letters; “overall” Marketing Mail letters, flats, and carrier route sorted mail; and “combined” inside- and outside-county Periodicals, all as reported to the PRC in the respective quarterly filings.)
Discerning the sources of the weekly numbers requires digging into that more granular quarterly data. For example, in its October 8 press release, the national “preliminary” figures declared by the Postal Service for the fourth quarter of its fiscal year (July 1 through September 30) were 88.0% for First-Class Mail, 92.6% for Marketing Mail, and 82.1% for Periodicals, all “against the [corresponding] USPS service standard.”
However, according to the data for First-Class Mail filed with the PRC, the three-to-five day standard was met only 87.2% of the time for Presorted First-Class Mail, and only 76.1% of the time for single-piece (retail) First-Class Mail. The Postal Service’s claim of “88.0% ... on time” clearly resulted from blending in better numbers from its achievement of the overnight and two-day delivery standards.
Similarly, though the USPS touted delivering “92.6% of Marketing Mail on time against the USPS service standard,” looking at the more detailed information shows that on-time delivery of origin-entered Marketing Mail was only 80.1% for letters and 62.4% for flats. Here again, the USPS used better figures, such as for mail SCF-entered by the mailer (96.4% for letters and 90.6% for flats) to lift the aggregated figure it reported.
The agency did the same for Periodicals; though its October 8 release asserted “82.1% of Periodicals [were delivered] on time against the USPS service standard,” the data filed with the PRC revealed that national service achievement for origin-entered inside-county and outside-county Periodicals was only 71.0% and 68.4%, respectively.
Similar cherry-picking may be practiced to select the numbers for the weekly press releases but, as noted, the origin and calculation of those figures isn’t disclosed by the Postal Service.
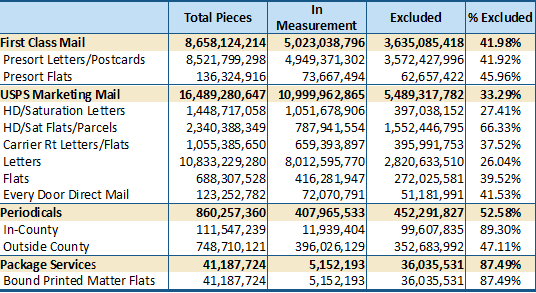
The final huge asterisk that should be attached to USPS service claims relates to the exclusion of significant portions of the mailstream from the universe of mail whose service experience is allegedly reported. The current “census” method being used by the Postal Service to measure service is reliant on a unique intelligent mail barcode on each piece so, by definition, the universe of mail eligible to be measured (and reported) consists of automation-compatible mail bearing an IMB – the easiest and fastest mail to process. What’s often overlooked by commercial mailers – and the media and public – is the business rules governing what mail is “in measurement,” i.e., included in or excluded from the service performance scores. In the Postal Quarter IV (July-September 2021) service performance data filed with the PRC, the USPS reported on the volumes of mail that were or weren’t “in measurement.”

This circumstance is analogous to a school district report on its students’ achievement in standardized testing if the universe of students on which the claim is based excludes those who weren’t on the honor roll or otherwise were ineligible to be included. Accordingly, when the USPS claims any given performance against its service targets, such claims should be (but are not) qualified to note (1) that they refer to only a subset of the total volume of mail and (2) that because that subset is only the “best” mail to process, actual net performance for the class or category of mail is lower, i.e., the mailer’s actual experience may vary.
The Spin
In reporting on service, the agency’s strategy seems to be to (1) supply high-level, aggregated numbers that homogenize the volumes of underlying performance data; (2) make a favorable comparison, such as to a time when service was clearly worse; and (3) consistently refer back to the base same time period (e.g., the end of a previous quarter) rather than to the previous week, thus enabling the claim for “continuous” improvement and obscuring the underlying variability. Again, this creates the desired appearance without disclosing any of the inconvenient details – such as that flats are still a problem, that some parts of the country are still experiencing bad service, or that three-to-five-day scores for First-Class Mail are well below the class average.
In a recent speech, a former president stated that “if you say it enough and keep saying it, they’ll start to believe you.” The gist of the remark is that people, typically disinterested in determining the veracity or accuracy of a statement, will, if they hear it repeated often enough, come to accept it as fact – and then themselves repeat it as fact.
This flaw in human nature lets clever marketers, politicians, and others with a position to promote broadcast a message that, even if not outright false, still provides a set of carefully selected facts that have been assembled to support the speaker’s contention. As noted, while the popular media and the general public accept as fully accurate the numbers in USPS press releases, many senders of commercial mail, especially of flats and Periodicals, find the agency’s claims particularly disingenuous. Of course, the USPS hopes that if it keeps telling people service is improving, no-one will look behind the claims and, in turn, will both believe and repeat what’s not entirely true.
Leo Raymond is Owner and Managing Director at Mailers Hub LLC. He can be reached at lraymond@mailershub.com.
This article originally appeared in the January/February, 2022 issue of Mailing Systems Technology.


